The human neocortex contains hundreds of types of neurons and glia1 that emerge early in development from what appears to be a more limited set of progenitor types2. Birthdating studies conducted in the 1970s have provided a blueprint for our understanding of cortical neurogenesis by revealing the sequential, inside-out production of cortical layers and subsequent generation of glia3, but were unable to resolve the exact developmental origins of these cells. Clonal lineage tracing studies in model organisms, especially in mice, have increased our understanding of development, revealing that radial glia in the ventricular zone (VZ) of the developing brain act as neural stem cells4,5,6,7,8. Radial glia differentiate according to an intrinsic neurodevelopmental hierarchy9 that involves not only deep and upper cortical layer neurogenesis, but also generation of astrocytes10, oligodendrocytes11 and olfactory bulb (OB) GABAergic neurons12,13,14. Extending these studies to primates and humans has been constrained by the low throughput of experimental approaches for mapping the clonal output of individual progenitor cells using observational methods such as time-lapse microscopy15,16,17. This limits our understanding of the degree of conservation of neurodevelopmental processes from mice to humans, which is important for three main reasons.
First, it has long been known that neurogenesis in the human cortex is protracted18,19 to support the expansion of the cerebral cortex. However, the cellular mechanisms that underlie this extended neurogenic window and the temporal dynamics associated with the transition to gliogenesis are poorly understood20. Second, cortical progenitor cells of humans and primates appear to disproportionately generate large numbers of GABAergic neurons21,22,23, but the cellular and temporal origins of these cells during development remain unknown. Finally, the developing human cortex contains truncated radial glia (tRG)—a distinct subtype of radial glia called that emerge during the second trimester2—but their contributions to corticogenesis are poorly characterized. Addressing these questions would provide important insights into the possible mechanisms of human cortical expansion.
Here we have applied massively parallel lineage tracing21 to profile the differentiation patterns of 6,402 neural stem and progenitor cells across periods of late second trimester neurogenesis and gliogenesis, capturing progenitors that reside in the major stem cell niches. Our lineage-resolved atlas of the developing human brain uncovers three novel insights into progenitor cell dynamics of the developing human cerebral cortex. First, we show that GABAergic neurons generated from cortical progenitors emerge after midgestation and their generation from cortical progenitor cells constitutes a previously unappreciated developmental switch from glutamatergic to GABAergic neurogenesis. Second, we uncover that tRG are capable of producing all major cortical cell types, and are particularly important for glutamatergic neurogenesis via generation of intermediate progenitor cells. Third, we show that in the late phases of cortical neurogenesis, VZ and inner subventricular zone (ISVZ) progenitors generate glutamatergic neurons. A subset of these neurons show transcriptomic similarity to deep cortical layer neurons, suggesting a possible late phase of cortical neurogenesis that might reactivate deep cortical layer programmes. Together, our work provides insight on the developmental dynamics of neural stem cell differentiation in humans and uncovers previously unappreciated relationships between neurogenic and gliogenic trajectories of neural stem niches.
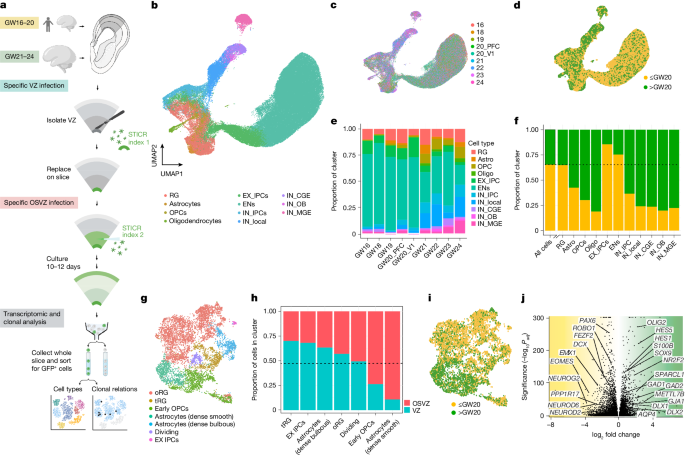
To create a lineage-resolved atlas of the developing human neocortex, we acquired 9 primary tissue specimens from 8 individuals before midgestation (n = 5, up to gestation week 20 (GW20)) and after midgestation (n = 4, after GW20) (Extended Data Table 1). These timepoints include middle and late stages of cortical neurogenesis and early gliogenesis, and harbour enriched expression of genes implicated in neurodevelopmental disorders and autism spectrum disorder24. To investigate how differentiation patterns of neural stem and progenitor cells change at these critical stages of development, we utilized STICR (single-cell RNA-sequencing-compatible tracer for identifying clonal relationships), a recently established tool for massively parallel clonal cell lineage tracing21,25 in which a molecularly barcoded lentiviral library with error-correctable barcodes enables tracing of clonal cell lineage of up to 250,000 individual cells per experiment with barcode collision probability of less than 0.5% (Fig. 1a). Across all nine tissue samples, we applied independent and molecularly indexed viral libraries of STICR to the germinal zones using VZ and outer subventricular zone (OSVZ)-specific labelling methods (Fig. 1a). We isolated GFP-positive cells after 10–12 days of ex vivo organotypic slice culture and processed the cells for single-cell RNA sequencing (scRNA-seq) to recover transcriptomic identities and lineage barcodes (Extended Data Figs. 1 and 2). Across all samples, we recovered 97,540 single cells that passed stringent quality control criteria, including 63,725 cells from specimens before midgestation and 33,815 cells after midgestation (Fig. 1c,d and Extended Data Fig. 1). We recovered STICR barcodes from 60% of cells passing quality control criteria (Extended Data Fig. 2c,d).
a, Experimental design for lineage tracing from dorsal cortical tissue samples across midgestation. Created in BioRender; Nowakowski, T. (2024) https://BioRender.com/hmdw1ry. b, Uniform manifold approximation and projection (UMAP) embedding and clustering of STICR-labelled cells following scRNA-seq. c, UMAP by sample, demarcated by gestational week at tissue acquisition. d, UMAP by pre- and post-midgestation (grouped). e, Bar chart showing the proportion of cells that belong to each cluster for each individual sample. f, Bar chart showing the proportion of cells from pre- or post-midgestation samples that contribute to each cluster. The dotted line represents the proportion of all cells obtained from pre-midgestation samples, regardless of cluster identity. g, UMAP comprising cells identified transcriptomically as radial glia and astrocytes, which were further subclustered to identify more specific subtypes (oRG and tRG). h, Bar chart showing the proportion of subclustered glial cells from g that were derived from the VZ or OSVZ. The dotted line represents the proportion of all cells obtained from VZ samples, regardless of cluster identity. i, UMAP of subclustered glial cells from g coloured by pre- and post-midgestation. j, Volcano plot showing differentially expressed genes between pre-midgestation radial glia (left) and post-midgestation radial glia (right). P values adjusted for multiple comparisons with Bonferroni correction. Selected genes are highlighted. METTL7B is also known as TMT1B.
To assign cell identities, we performed unbiased clustering and then analysed gene expression profiles of individual clusters and projected marker gene expression for specific cell types across all cells (Extended Data Fig. 1c,d and Supplementary Table 1). We thus annotated radial glia (RGs, HES1-positive (HES1+)), intermediate progenitor cells (EX_IPCs, EOMES+), glutamatergic neurons (excitatory neurons (ENs), SLC17A7+), GABAergic neurons (inhibitory neurons (INs), GAD2+), astrocytes (SPARCL1+), oligodendrocyte precursor cells (OPCs, OLIG2+) and oligodendrocytes (MBP+) (Fig. 1b, Extended Data Fig. 3a and Supplementary Table 2). Cells from all samples were found across all clusters (Fig. 1e and Extended Data Fig. 1e,f). As expected26, we found greater proportions of intermediate precursor cells (IPCs) and glutamatergic neurons in specimens before midgestation than after midgestation (85% versus 15% for EX_IPC and 75% versus 25% for EN) (Fig. 1f and Extended Data Fig. 1f). In parallel, we observed a higher proportion of macroglia (astrocytes, oligodendrocytes and OPCs) after midgestation (Fig. 1f and Extended Data Fig. 1f), consistent with the onset of gliogenesis around GW2027,28. We also observed a higher proportion of GABAergic cells in post-midgestation samples, increasing from 6.7% to 33% of all cells (Fig. 1f and Extended Data Fig. 1f), as expected on the basis of the progressive migration of interneurons from the ganglionic eminences over time28.
To better understand the progenitor cells that were present in these samples, we performed further analysis of the progenitor and glial cells, which are closely related transcriptomically. Progenitors and macroglia were iteratively subclustered from the full dataset on the basis of marker gene expression, focusing on putative astrocytes (SPARCL1+ or CD44+) and radial glia (HES1+, VIM+, FOXG1+ and EMX2+) (Fig. 1g and Extended Data Fig. 3a,b). Analysis of these subclusters revealed a population of putative outer radial glia (oRG) (INPP1+ and PPM1K+), tRG (CRYAB+ and ANXA1+), putative early OPCs (PDGFRA+) and two distinct subpopulations of astrocytes corresponding to grey matter ‘dense bulbous’ astrocytes (S100A11+) and white matter ‘dense smooth’ astrocytes (ANGPTL4+ and TIMP3+)29 (Extended Data Fig. 3c–g). During initial STICR labelling, germinal zones were labelled with separate indices to track the spatial origins of daughter cells (Fig. 1a). We observed that the majority of tRG were derived from the VZ, whereas oRG were derived from both the VZ and the OSVZ (Fig. 1h). Consistent with prior reports, the grey matter dense bulbous astrocytes were more commonly derived from the VZ, whereas white matter dense smooth astrocytes were derived from the OSVZ29 (Fig. 1h).
Radial glia were observed throughout the second trimester, but exhibited substantial variations in gene expression across time (Fig. 1i,j, Extended Data Fig. 3d and Supplementary Table 3). Pre-midgestation radial glia were enriched for genes associated with excitatory neurogenesis, including PAX6, FEZF2, NEUROG2, NEUROD2 and NEUROD6, and with genes that are characteristic of intermediate progenitor cells including EOMES and PPP1R17 (Fig. 1k). These early cells were also enriched in genes associated with the Wnt pathway, consistent with prior reports30 (Supplementary Table 3). By contrast, post-midgestation radial glia were enriched for genes associated with astrocytes (S100B, SPARCL1, GJA1 and AQP4) and oligodendrocyte precursor cells (OLIG2) (Fig. 1j). These later radial glia also showed an increase in expression of HES1 and HES5, which have been shown to repress excitatory neurogenesis31. Together, these findings show that both germinal niche and developmental age are correlated with different patterns in lineage outputs from neural stem and progenitor cells.
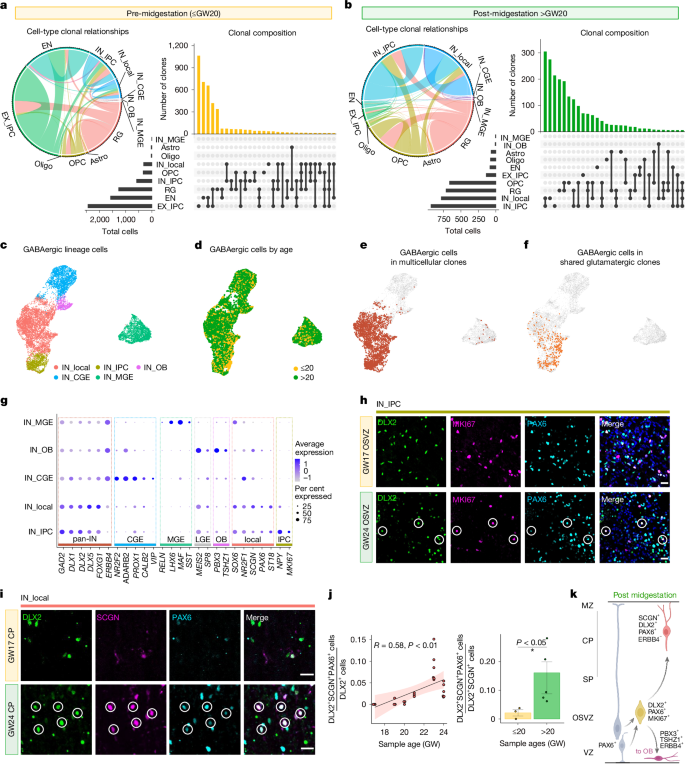
To determine how progenitor output changes across midgestation, we focused our analysis on multi-cellular clones (those with at least two cells that share the same lineage barcode) before and after midgestation (Fig. 2a,b). Our analysis identified 4,209 multi-cell clones from specimens obtained up to GW20, and 2,193 from specimens obtained after GW20 (Extended Data Fig. 2a,b). Before midgestation, the vast majority (77.6%) of clones contained glutamatergic cells (EX_IPCs or ENs) (Fig. 2a and Extended Data Fig. 4a). By contrast, only 9.9% of clones contained glutamatergic lineage cells after midgestation, whereas 40% of clones comprised OPCs, oligodendrocytes or astrocytes (Fig. 2b and Extended Data Fig. 4a). Although we captured relatively few multi-cellular clones that contain astrocytes (1% of all pre-midgestation clones and 3.6% of all post-midgestation clones), 26% of astrocyte-containing clones also included OPCs, consistent with the recently discovered dual-potency glial progenitor in the human neocortex32 (Extended Data Fig. 4c). In mice, OPCs are known to derive from both the ventral ganglionic eminences and from cortical radial glia20,27. In our dataset, 58% and 46% of OPC-containing clones shared barcodes with radial glia before and after midgestation, respectively, suggesting a strong contribution of dorsally derived OPCs in humans throughout midgestation (Extended Data Fig. 4b). Together, these findings suggest that in contrast to mice, the onset of gliogenesis in human cortical development occurs gradually and coincides with ongoing neurogenesis.
a,b, Left, chord diagrams for pre-midgestation (a) and post-midgestation (b) samples in which the thickness of connecting lines represents the frequency of clonal relationships between the two linked cell types. Right, upset plots representing the cell-type abundance (bottom left), types of clones (bottom right) and the abundance of each clone type (top right) for multi-cellular clones in pre- and post-midgestation samples. c, UMAP embedding and subclustering of GABAergic neurons. d, GABAergic neuron UMAP coloured by pre- and post-midgestation (grouped). e,f, GABAergic neurons in multi-cellular clones (e) and GABAergic neurons in multi-cellular clones (f) where one or more of the other cells in the same clone are in the excitatory lineage (EX_IPC or EN), projected in UMAP space. g, Dot plot of expression of cell-type markers and percentage of cells expressing the marker within each subcluster. h, Immunohistochemical staining of DLX2, MKI67 and PAX6 at GW17 and GW24. Example cells with triple-positive co-localization are marked by circles. Scale bars, 20 μm. i, Immunohistochemical staining of DLX2, SCGN and PAX6 in the cortical plate (CP) of GW17 and GW24 samples. Example cells with triple-positive co-localization are marked by circles. Scale bars, 20 μm. j, Left, ratio of DLX2+SCGN+PAX6+ cells to DLX2+ cells quantified from immunohistochemical stains such as those in i. Dots represent mean cell counts from the cortical plate (excluding the marginal zone) from each 20× image that was quantified (n = 3 images per sample; n = 8 samples; samples from GW17, GW19, GW20, GW21, GW23, GW23, GW24 and GW24). The black line represents linear regression, with 95% confidence interval in pink. Pearson’s correlation coefficient (R) is shown, P = 0.0029. Right, ratio of DLX2+SCGN+PAX6+ cells to DLX2+SCGN+ cells in pre- and post-midgestation samples. Dots represent mean counts from each biological replicate (n = 3 images per sample) and coloured bars represent means per binned age group (n = 3 samples for pre-midgestation, mean = 0.021, n = 5 samples for post-midgestation, mean = 0.14). Error bars show s.e.m. for each age group. Two-sided Student’s t-test, P = 0.046. k, Model of how dorsally born GABAergic neurons emerge and migrate in the cortex. Dotted lines represent a lineage relationship. Created in BioRender; Nowakowski, T. (2024) https://BioRender.com/4fgwqb2.
Unexpectedly, our data also revealed a marked shift from glutamatergic neurogenesis to GABAergic neurogenesis around midgestation, with 62% of multi-cell clones containing GABAergic cells (IN_IPCs or inhibitory neurons (INs)) after GW20 (Fig. 2b). To determine what types of GABAergic neurons are generated locally within the germinal zone of the cerebral cortex, we performed iterative clustering that identified five types of GABAergic cells (Fig. 2c and Extended Data Fig. 5a–c). Caudal ganglionic eminence (CGE)-derived GABAergic neurons (NR2F2+ and ADARB2+) and medial ganglionic eminence (MGE)-derived GABAergic neurons (LHX6+ and MAF+) were both enriched for ERBB4, a marker of tangential migration, consistent with their presumed ventral origin33 (Fig. 2d,g). Only a small fraction (0.7%) of these cells were present in multi-cellular clones (Fig. 2e), and no cells in this cluster shared lineage barcodes with glutamatergic neurons or cortical radial glia (Fig. 2f and Extended Data Fig. 2d,e), suggesting that they represent a rare tangentially migrating GABAergic neuroblast derived from CGE or MGE34,35,36. We also identified OB interneurons (PBX3+ and TSHZ1+) (Fig. 2g and Extended Data Fig. 5b,d,g,h), a subset of which were found in multi-cell clones, consistent with their dorsal origin12,13,14 (Fig. 2e and Extended Data Fig. 5e,f). We identified a progenitor population that was enriched for MKI67 (IN_IPC; Fig. 2g), consistent with prior studies21,37. We validated that these IN_IPCs were present even in uncultured tissue throughout the VZ and OSVZ using immunohistochemistry, especially in post-midgestation samples (Fig. 2h and Extended Data Fig. 6). Finally, we identified a cluster (IN_local) of GABAergic neurons that co-express a subset of CGE (NR2F1), MGE (SOX6) and lateral ganglionic eminence (LGE, MEIS2) markers (Fig. 2g,i and Extended Data Fig. 5c). IN_local cells could be further distinguished from other populations by their enriched expression of transcription factors PAX6 and ST18 (Fig. 2g).
Almost all GABAergic cells that were found in multi-cellular clones (98%) belonged to IN_IPC and IN_local clusters, and only cells in these clusters shared barcodes with glutamatergic lineage cells, including cortical (PAX6+ and EMX1+ and/or EMX2+) radial glia or neurons (Fig. 2e,f and Extended Data Figs. 4a,e and 5e,f). In addition, GABAergic-lineage cells frequently shared lineage relationships with OPCs (Extended Data Fig. 4a,b,e), consistent with a recently described dorsally derived multipotent progenitor that can produce both oligodendrocytes and GABAergic-lineage cells38.
To determine the distribution of presumed locally born GABAergic neurons, we stained uncultured tissue for SCGN, DLX2 and PAX6 proteins. SCGN+DLX2+ cells were found throughout the telencephalic wall, especially in the cortical plate and marginal zone (Fig. 2i and Extended Data Fig. 7), aligning with the known distribution of CGE-derived cortical interneurons in humans and primates28,34. Consistent with the lineage tracing data (Fig. 2a–f), the abundance of SCGN+DLX2+PAX6+ triple-positive cells increases significantly around midgestation (Fig. 2i,j and Extended Data Figs. 7 and 8b,c). PAX6+ interneurons comprised approximately 15% of SCGN+DLX2+ cells in post-midgestation samples, indicating that at this point in development, most of the cortical SCGN+ population is likely to be derived from CGE28,34 (Fig. 2j). Notably, SCGN+PAX6+ cells can also be detected in the cortical plate at GW30 and GW39, suggesting that these cells persist in the cerebral cortex throughout birth (Extended Data Fig. 8d,e).
In one sample with known regional annotation, we performed lineage tracing in the prefrontal cortex (PFC) and visual cortex (V1). IN_local and IN_IPC cells were present in 36% of multi-cellular clones collected from PFC, versus 15% from V1 (Extended Data Fig. 9a,b), which was consistent with immunostaining validation performed in uncultured tissue (Extended Data Fig. 9c–f). Differences in the abundance of IN_local and IN_IPC cells across areas could reflect the neurogenetic gradient that is known to exist in the developing brain39,40,41. Together, our study identifies late second trimester as a point of onset of locally generated GABAergic neurons, and identifies molecular features that distinguish these cells from their CGE-derived and MGE-derived counterparts, as well as from presumed OB interneurons (Fig. 2k).
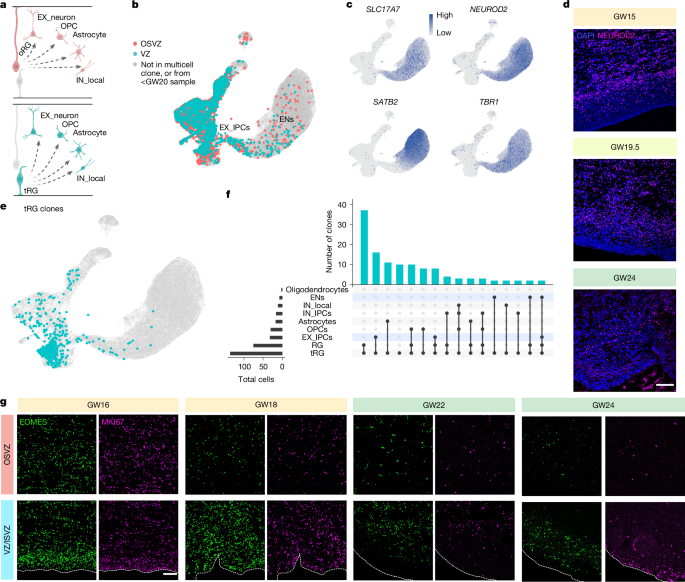
Beyond describing the origins of different subtypes of cortical neurons, we also sought to characterize the progenitors themselves more thoroughly, particularly tRG, a subtype of apical radial glia that emerges around GW17 in humans2. In contrast to oRG, whose differentiation trajectories have been studied extensively15,27,42,43,44, the developmental fate of cells derived from tRG remains poorly understood29,45,46 (Fig. 3a). We identified tRG and oRG in our samples transcriptomically (Extended Data Fig. 3), and utilized clonal barcoding information from STICR to perform careful analysis of the clones that contained each radial glia (RG) subtype (Fig. 3b–e). Both oRG and tRG were capable of producing all cell types including excitatory lineage cells, inhibitory lineage cells and macroglia (Fig. 3f and Extended Data Fig. 4f). Radial glia were most commonly recovered alongside other clonally related radial glia, confirming that both RG subtypes can self-renew (Fig. 3c,e). Indeed, among clones that contain only two recovered cells, we observed global fate restriction, in that recovered cells were more likely to belong to the same general category of cell type than would be expected by chance (Extended Data Fig. 10). Surprisingly, our lineage tracing analysis identified extensive clonal coupling between tRG and EOMES+ IPCs (EX_IPCs) or glutamatergic neurons (ENs) (Fig. 3d,e).
a, Proposed model of oRG and tRG contributing to the generation of all major cell types in the cortex. Created in BioRender; Nowakowski, T. (2024) https://BioRender.com/q3p1372. b, UMAP embedding of cells in multi-cellular clones from post-midgestation (after GW20) samples originating in the OSVZ and VZ. c, Feature plots showing markers of glutamatergic neurons (SLC17A7, NEUROD2, SATB2 and TBR1). d, Immunohistochemical staining of NEUROD2 and DAPI at the VZ/ISVZ across midgestation. Scale bar, 100 μm. e, UMAP of all cells from the study. Cells that share a lineage relationship with tRG are shown in teal. f, Upset plot of all multi-cellular clones that contain at least one tRG, showing cell-type abundance (bottom left), types of clones (bottom right) and the abundance of each clone type (top right). g, Immunohistochemical staining of EOMES and MKI67 in the OSVZ and VZ/ISVZ from pre-midgestation (GW16 and GW18) and post-midgestation (GW22 and GW24) samples. VZ and OSVZ locations as well as tissue boundaries were identified on the basis of DAPI density. Scale bar, 100 μm.
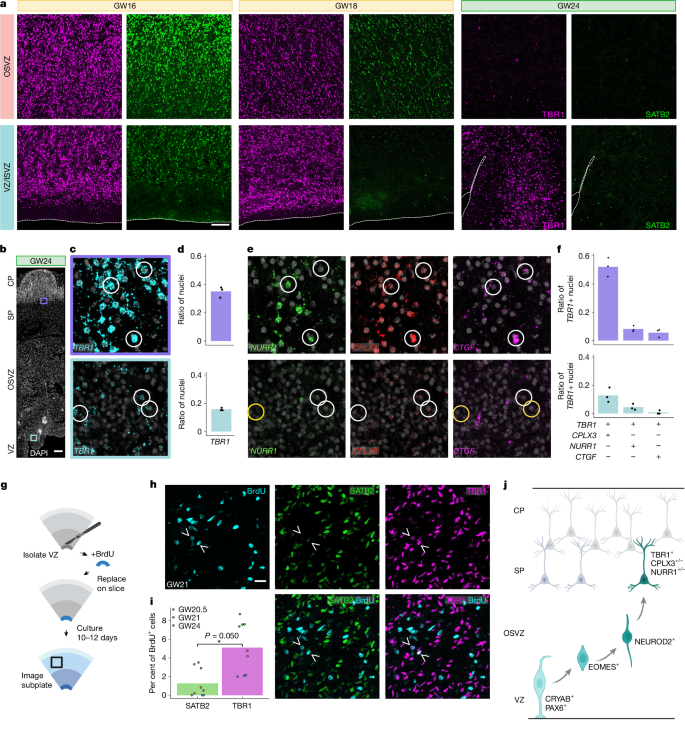
Because tRG and their clonal coupling to EX_IPCs was identified both pre- and post-midgestation, we explored whether tRG contribute to a persistent late phase of glutamatergic neurogenesis in humans. Immunostaining of primary uncultured tissue sections confirmed an abundance of dividing cells and EOMES+ IPCs in the germinal zones of primary tissue sections late in second trimester, notably enriched in the VZ and ISVZ (VZ/ISVZ) region (Fig. 3f and Extended Data Fig. 11). This is consistent with our finding that most IPCs in our dataset originated from VZ infections rather than OSVZ infections when looking across all ages (Fig. 1h). Because IPCs are known to generate excitatory neurons, we also explored whether NEUROD2+ cells were present in the germinal zones post-midgestation. Indeed, even in late second trimester, a substantial number of multi-cellular clones contained glutamatergic IPCs or neurons, marked by expression of SLC17A7, NEUROD2 and other canonical markers (Fig. 3b,c and Extended Data Fig. 4a). Immunostaining of uncultured tissue further confirmed the presence of NEUROD2+ cells in germinal zones including the VZ/ISVZ region (Fig. 3d, Extended Data Fig. 12). Together, these data reveal that tRG that reside in the ventricular zone remain neurogenic in the late second trimester. Next, we explored the identity of these late-born glutamatergic neurons. Unexpectedly, we found that the presumed late-born glutamatergic neurons that were still in the germinal zones expressed high levels of TBR1, but not SATB2 (Fig. 4a and Extended Data Fig. 13). During mouse development, TBR1+ neurons are generated during early development and contribute to deep layers of the cerebral cortex47, whereas SATB2+ cells contribute to upper layers and are born later according to the inside-out model of cortical development48. To better understand how late-born glutamatergic neurons compare to deep layer neurons generated during first trimester in humans, we performed scRNA-seq from microdissected VZ/ISVZ tissue specimens and compared key marker gene expression to data derived from first-trimester specimens49, focusing on glutamatergic neurons (Extended Data Fig. 14a). Both late-born and early-born neurons expressed high levels of TBR1 and NEUROD2, as well as more specific subplate neuron markers such as TLE4, NR4A2 (also known as NURR1), CTGF (also known as CCN2) and NFIB (Extended Data Fig. 14b–p). We validated expression of subplate markers CPLX3 and/or NR4A2 and/or CTGF in some VZ/ISVZ-located TBR1+ cells using in situ hybridization after midgestation (Fig. 4b–f and Extended Data Fig. 15). Of note, we observed strong expression of CTGF in tRG (Extended Data Fig. 15), consistent with prior reports50.
a, Immunohistochemical staining of GW16, GW18 and GW24 samples for excitatory neuron markers SATB2 and TBR1. The dotted line at the edge of the tissue was determined with DAPI. Scale bar, 100 μm. b, In situ hybridization of TBR1 in a GW24 sample. Scale bar, 200 μm. SP, subplate. c, Magnified views of the subplate (purple outline) and VZ (cyan outline) from b. d, Quantification of nuclei positive for TBR1 in the subplate and VZ. Points on graph represent individual 20× fields of view (FOVs) (n = 3). e, In situ hybridization of subplate markers NURR1, CPLX3 and CTGF at the subplate (top) and VZ (bottom). White circles represent example nuclei positive for a given marker and yellow circles represent cells that are negative for a given marker. f, Quantification of TBR1+ nuclei that are also positive for a given marker in the subplate (purple) and VZ (cyan). Points on the graph represent individual 20× FOVs (n = 3). g, Experimental design for validation of glutamatergic neurogenesis in post-midgestational tissue by local labelling of the VZ with BrdU followed by 10 days of slice culture. Created in BioRender; Nowakowski, T. (2024) https://BioRender.com/yvs0w4k. h, SATB2 and TBR1 immunohistochemical staining and BrdU staining of sections, imaged at the subplate. BrdU+TBR1+ cells are indicated with arrowheads. Scale bar, 20 μm. i, Quantification of BrdU+ cells from GW20.5, GW21 and GW24 samples. There were more BrdU+TBR1+ cells than BrdU+SATB2+ cells in the subplate (two-sided paired t-test for mean of technical replicates, P = 0.050). Each point represents an individual 20× FOV (n = 3) from each sample (n = 3). j, Model for role of VZ radial glia in neurogenesis post-midgestation. Created in BioRender; Nowakowski, T. (2024) https://BioRender.com/1yrcfzk.
Finally, because some late-born glutamatergic neurons shared transcriptomic identity with classical subplate and deep layer neurons, we tracked the migration of late-born neurons in culture. To validate subplate localization of these neurons, we performed BrdU labelling of microdissected VZ/ISVZ tissue specimens (Fig. 4g). After 10 days of organotypic slice culture, approximately 5% of BrdU-labelled cells expressed TBR1, whereas only 1.2% expressed SATB2 (Fig. 4h,i). A subset of BrdU-labelled TBR1+SATB2− cells were located in the cortical subplate across multiple late-midgestation samples (Fig. 4h,i and Extended Data Fig. 16), suggesting that VZ-derived late-born glutamatergic neurons may contribute new neurons to the cortical subplate (Fig. 4j). Together, our results indicate that late-born glutamatergic neurons adopt similar molecular identities to early-born subplate neurons, supporting a long-standing hypothesis of continued expansion of the subplate throughout the second trimester51,52.


